
A few years ago I wrote an FX EA and actually traded it live. Not just backtest, real money on a real broker account. The idea was simple: only trade when it’s quiet near broker midnight, fade the price when it stretches too far, and get out fast. It’s boring to watch but it worked.
I don’t have the code anymore. But I still had some old MetaTrader reports sitting around in different folders, plus some screenshots from the live account. So I decided to go back and record what I did, clean up the old data, rebuild the strategy in Python, and write down what actually happened.

What I Still Remembered
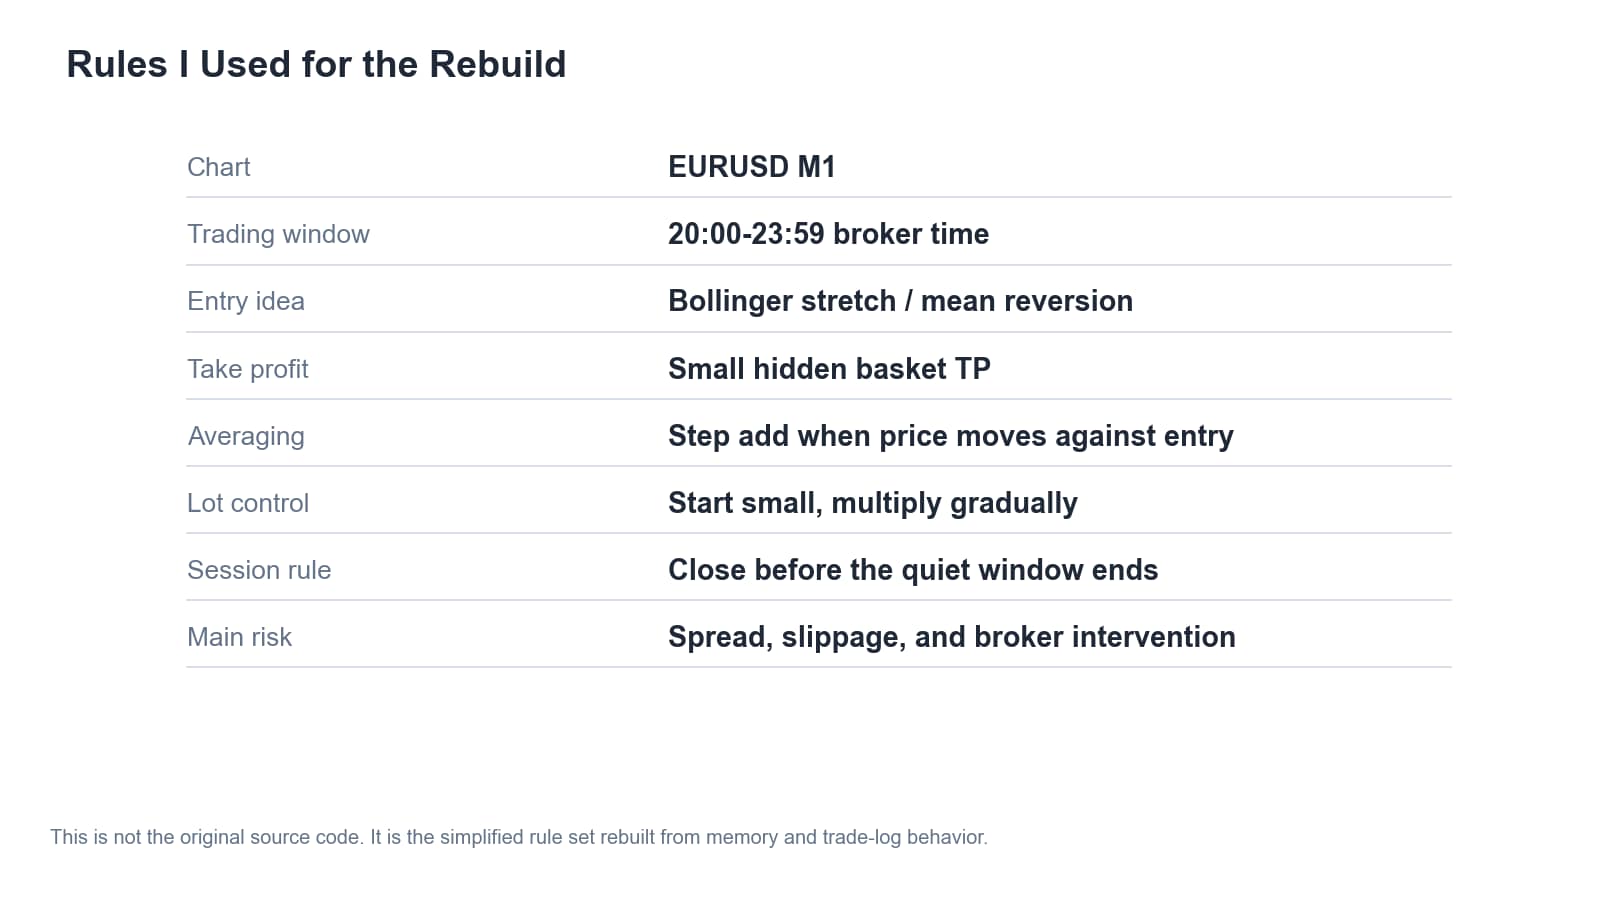
I didn’t remember every parameter, but the structure was clear enough:
- Timeframe: M1, because the trades were short and target was small.
- Window: around broker midnight, when liquidity is low.
- Signal: price stretched away from short-term range, something like Bollinger Bands.
- Trade management: small hidden TP, step-adding when price goes against you, session close rule.
- The risk: if spread widens or slippage happens, there’s no edge left. A few-pip target has no room for error.
Live Trading Evidence
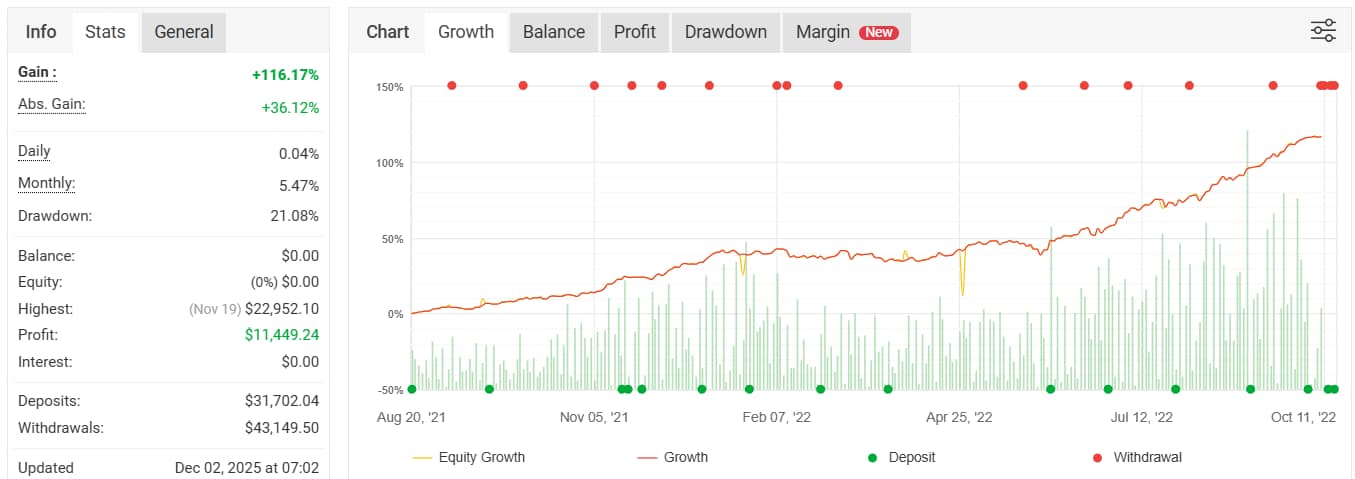
Before I go into the analysis, it’s worth showing that I actually traded this live, not just backtested and forgot about it. I still have the old screenshots from the account — deposits, withdrawals, closed trades, breakdown by pair. Not a big account, but real money and real execution.
Cleaning the Old Logs
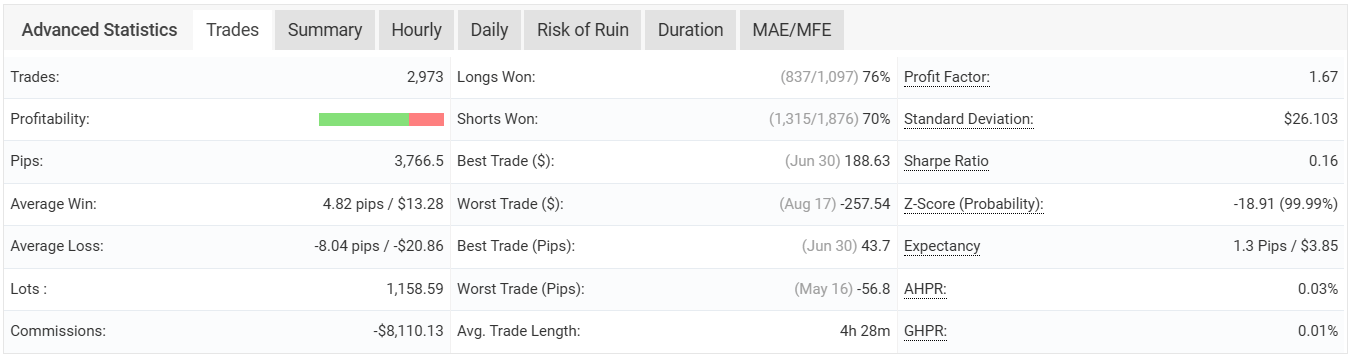
Besides the live screenshots, I also had old MetaTrader backtest reports from different experiments. These are strategy tester results, not live account statements. After I cleaned and parsed them, I got 30,469 closed trades from August 2018 to November 2022, with about 79.1% win rate and around $737k total backtest profit across all the files.
Just to be clear, these are backtest numbers, not live fills. Backtest doesn’t have real slippage, rejections, or broker interference, so the dollar amounts are just for reference — useful to see the pattern, not to claim I actually made that much. The consistency of the pattern across different test runs is what I found useful.

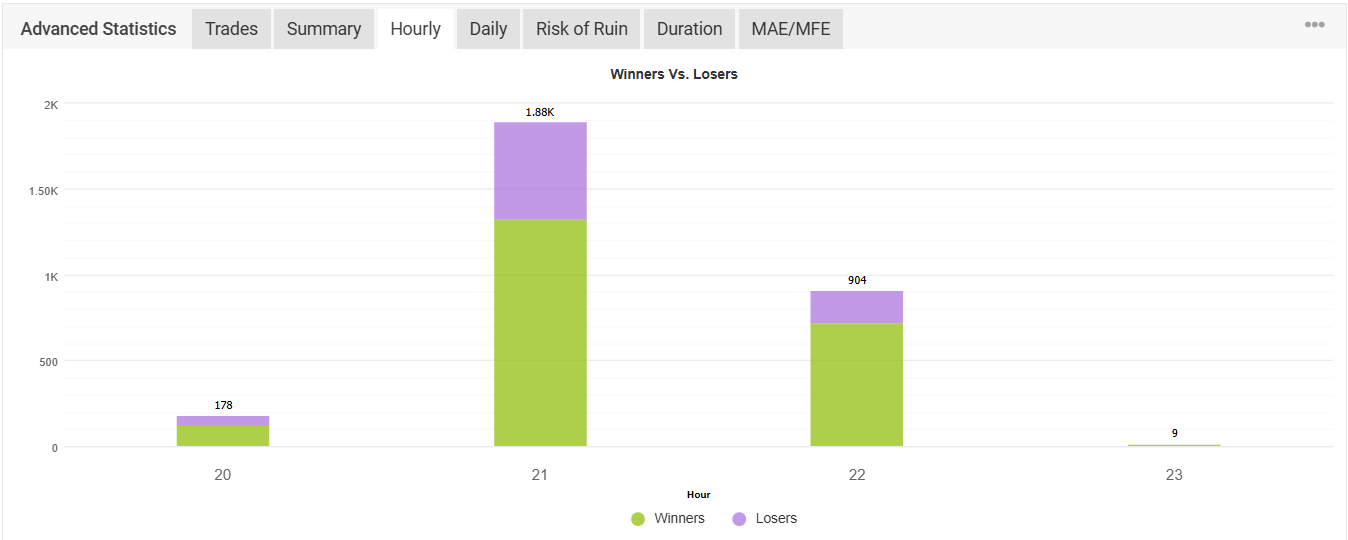
The Edge Was Mostly About Timing
The clearest thing in the data was time. Most of the profit came from around broker midnight. Trade the same setup at other hours and the results were much worse. This makes sense — when liquidity is thin, price tends to overshoot and then snap back. That’s the whole idea of the trade.
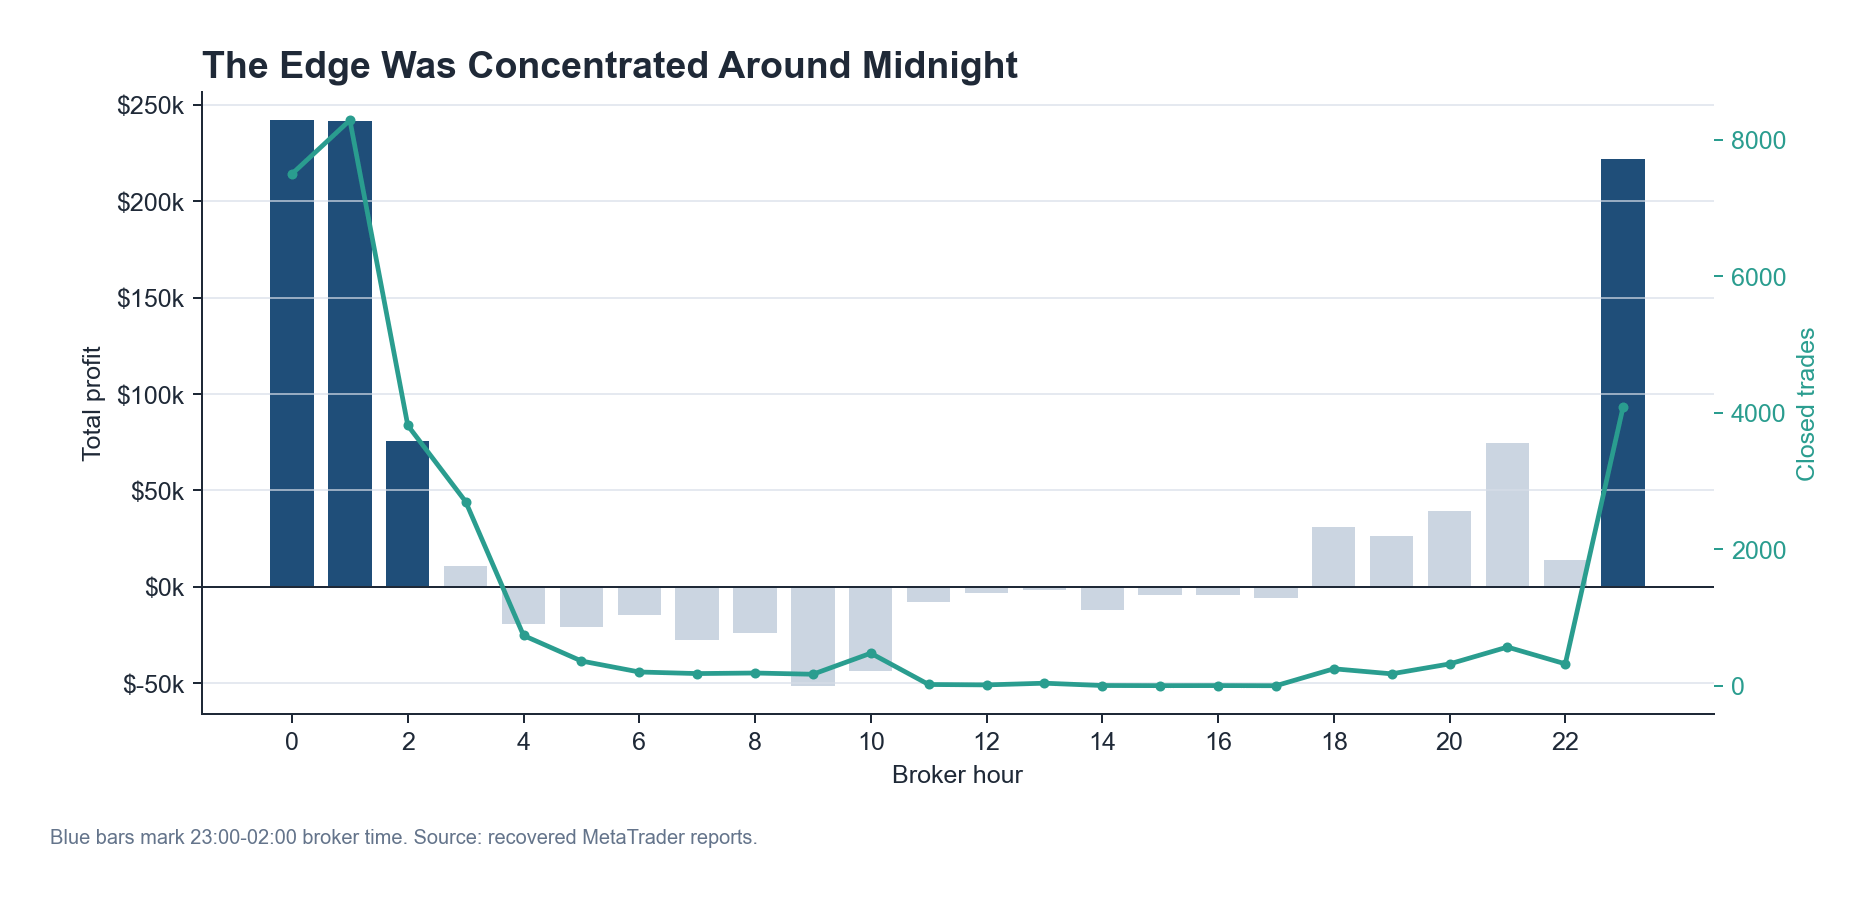
The indicator by itself wasn’t enough. The hour was what made it work. A Bollinger stretch signal at 3pm London is just noise. The same signal at 11pm broker time, on a pair that tends to mean-revert, with low spread — that’s a totally different thing.

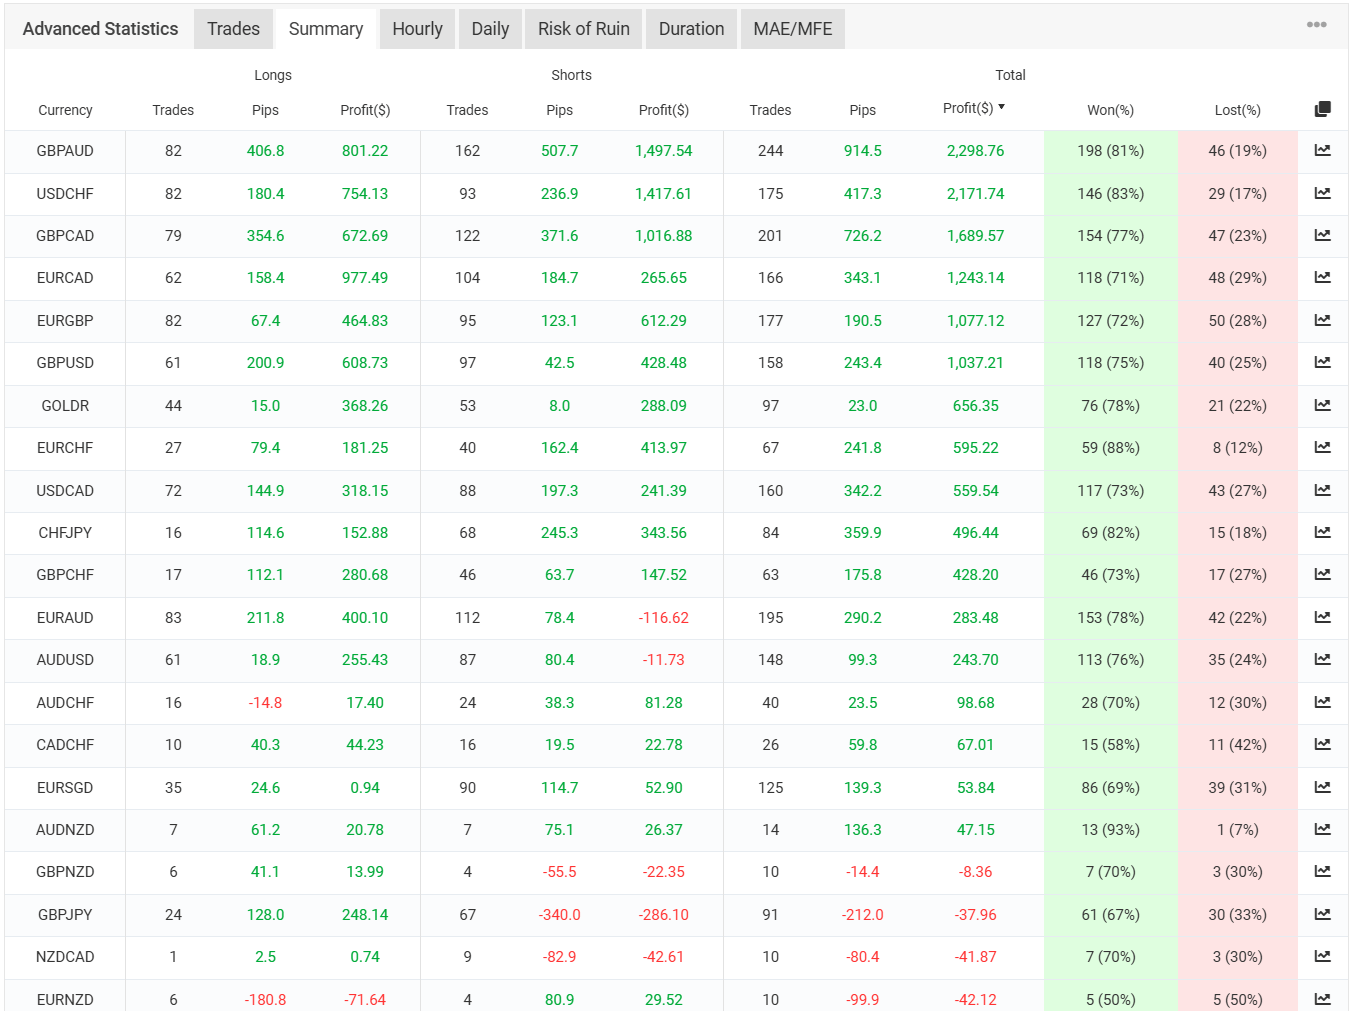
Pair Selection Also Mattered
Not every pair was the same. Some pairs showed clean mean-reversion during the quiet window. Others were too noisy or the spread was too high. The edge came from the combination: right hour, right pair, low spread, small exit. Change any one of these and the result changes.

Rebuilding It in Python
Since I didn’t have the original code, I rebuilt it from scratch in Python based on what the logs showed. I didn’t try to copy the EA line by line. I just wanted to check: can the same idea still work with clear rules that I can control?
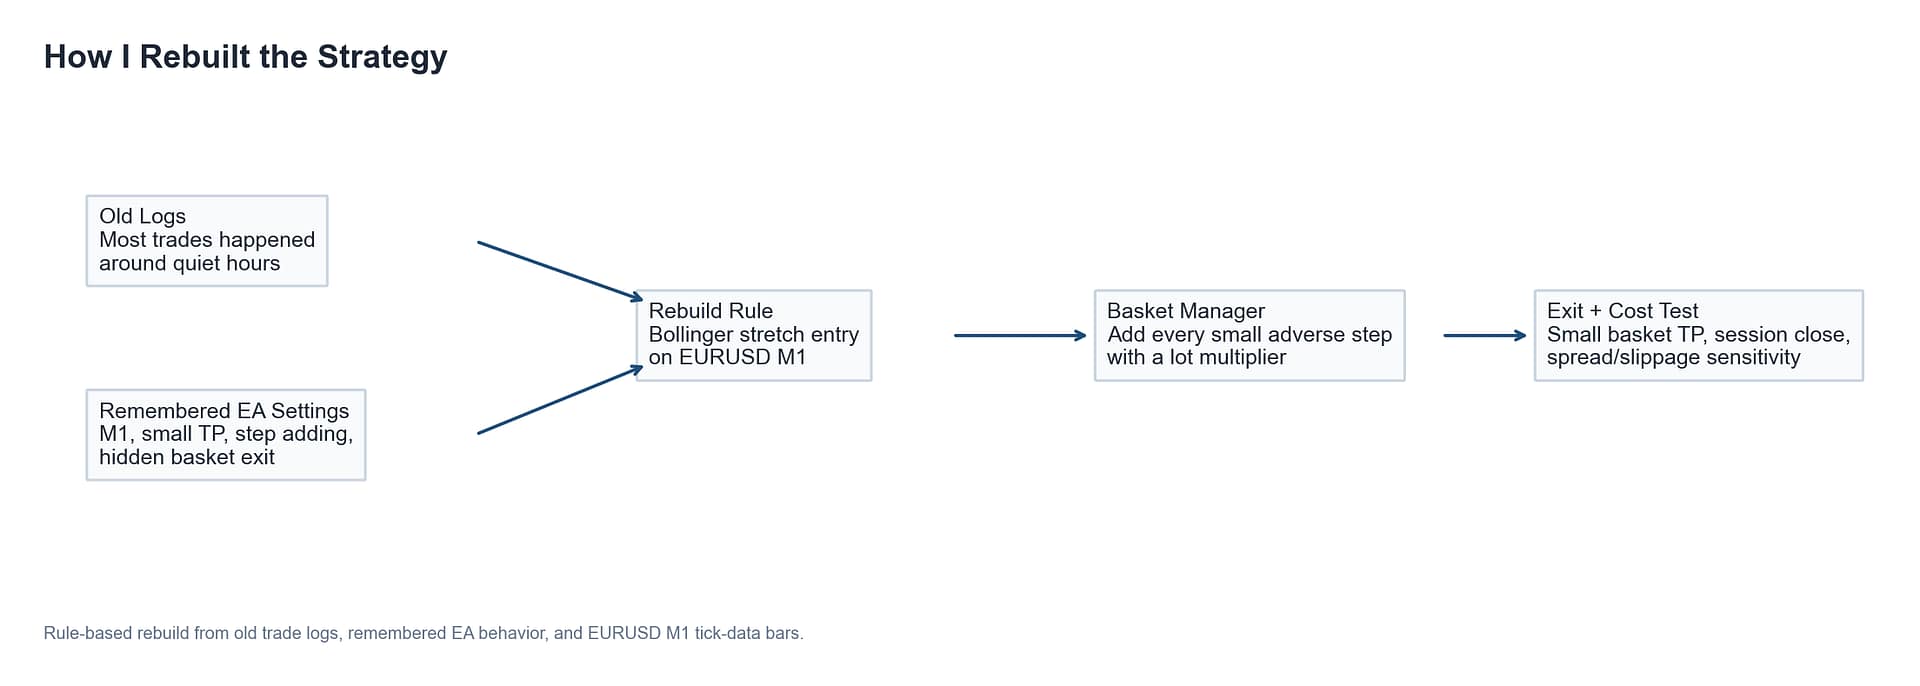
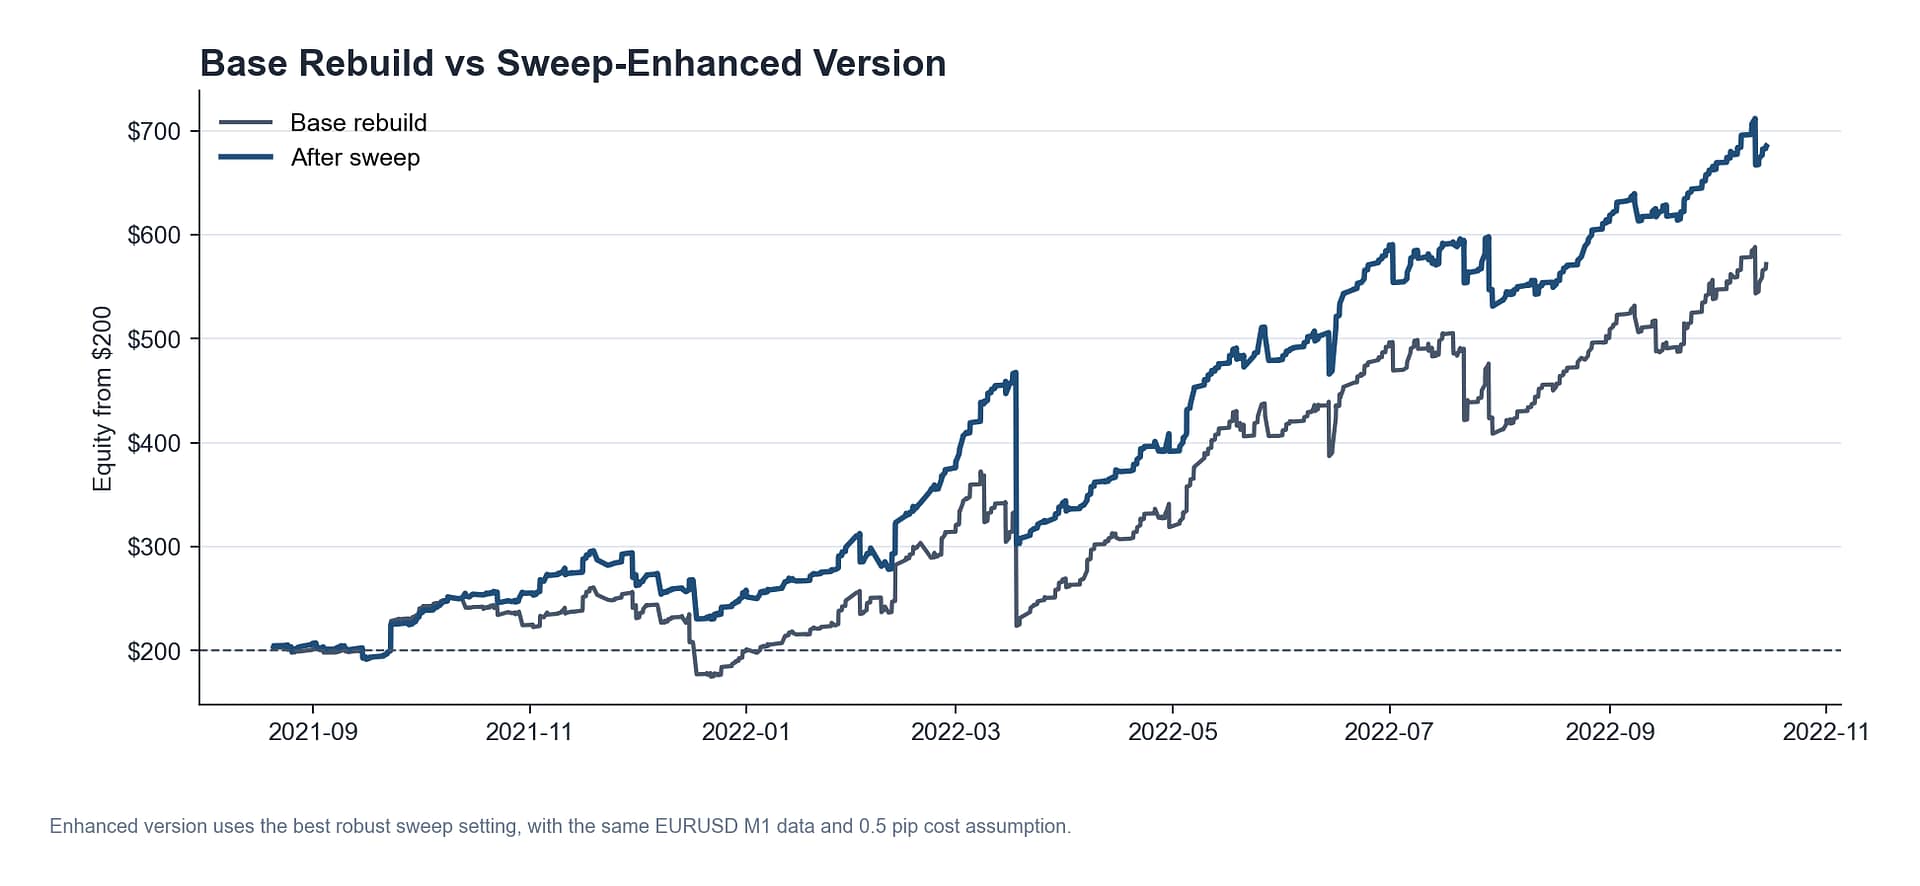
Setup: EURUSD M1 data, trading window 20:00–23:59 broker time, Bollinger stretch entry, step averaging, basket TP, session close. I used 0.5 pip round-trip cost because I didn’t want the test to look too clean.
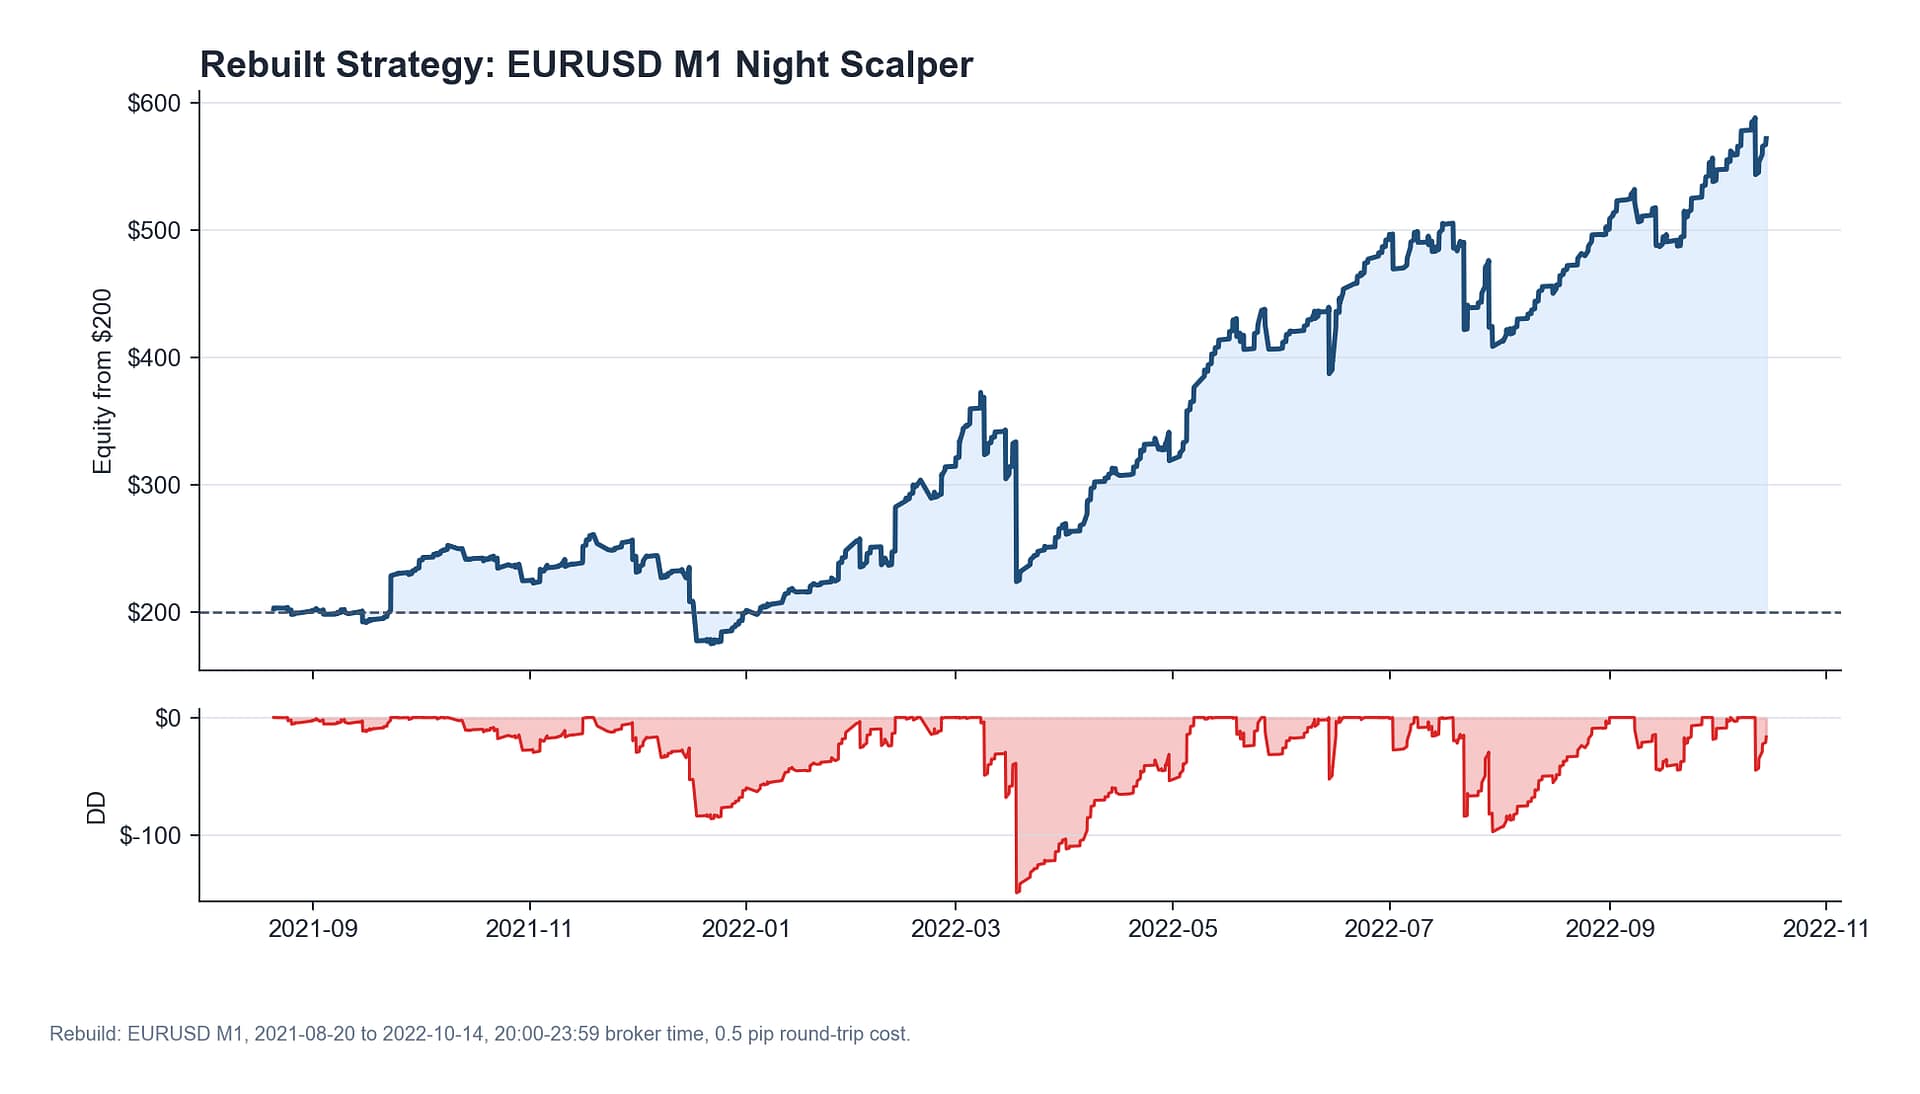
Results over the test period (Aug 2021 – Oct 2022): 1,288 basket trades, 86.4% win rate, $200 grew to about $572, max drawdown around -$149. The drawdown is worth noting — this style looks smooth most of the time, but when a basket goes against you it can hit hard before closing out.

It’s not the same as the live results, and I wouldn’t say it is. But it does reproduce the main behavior: high win rate, lots of small wins, concentration in the night hours, and sensitive to cost.
Parameter Sweep
After the base rebuild worked, I did a small sweep on the parameters that made sense to change — trading window, Bollinger threshold, step size. Not a random grid search on everything, just the ones where I had a reason from the old EA to think different values might help.

The best one used a stricter Bollinger threshold and a smaller step. Trades dropped from 1,288 to 1,135, win rate almost the same at 86.3%, and final equity went from ~$572 to ~$685. Drawdown was a bit higher at about -$165. More selective, not fundamentally different, which is what you want.
Why Multiple Pairs Matter
The Python rebuild above is EURUSD only because that’s the pair I had clean M1 data for. But the original EA was never single-pair — it ran across a basket, and that’s a big reason why the live results looked better than one pair alone.
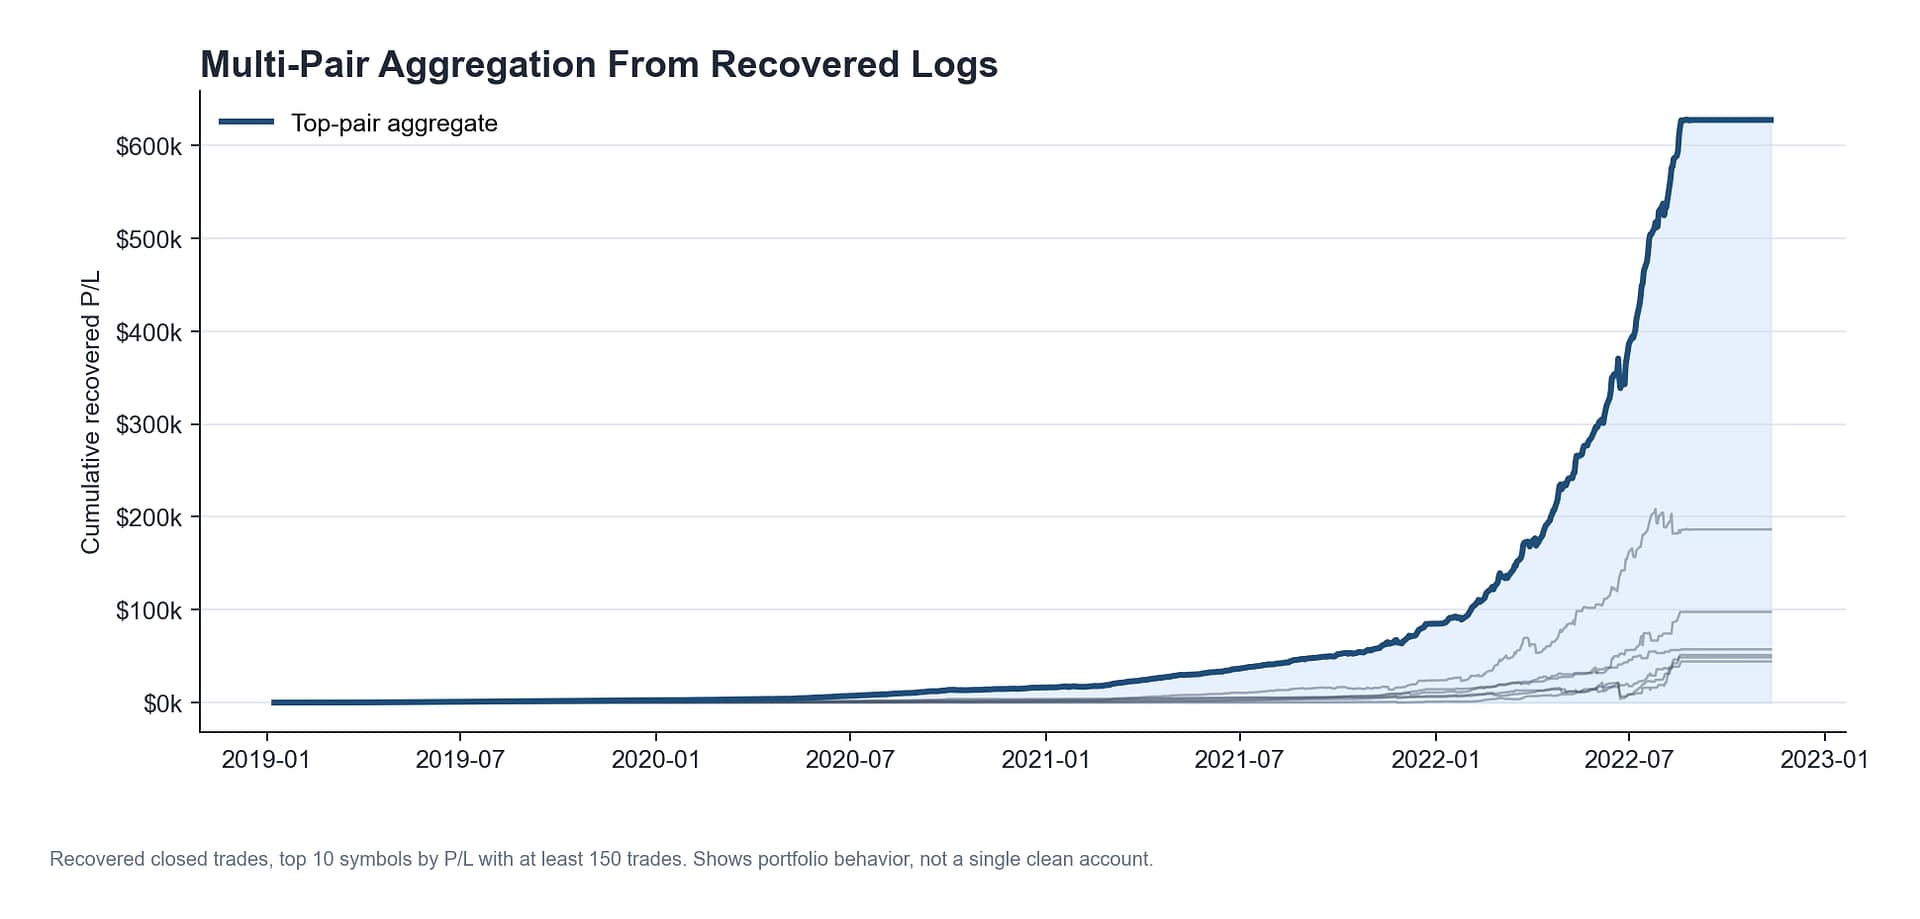
When I aggregate the top 10 pairs from the recovered logs: 17,985 trades, about 80.3% win rate, around $627k recovered P/L. Again this is from old reports, not a fresh backtest. But it explains why the original strategy worked better than just EURUSD — when one pair is doing badly, others carry it.

The Broker Problem
Most retail FX brokers are market makers (B-book), so they take the other side of your trades. If you’re losing, they don’t care. But if you’re consistently making money on a scalping strategy with small targets, that’s coming directly out of their book.
What happens next is always the same: spread widens during rollover, fills get delayed, slippage shows up, orders get rejected. Then you get an email saying your account has been suspended for “abusive trading.” The funny thing is, brokers don’t mind martingale or grid strategies that compound risk — those blow up eventually, so the broker always wins in the end. But consistent low-risk scalping that keeps going one direction? They don’t want that. I don’t believe there’s any holy grail in trading, but if your curve looks too clean for too long, they will come after you.

The cost sensitivity chart above shows why this matters for a scalper. Half a pip of extra slippage on a 1–3 pip target is a lot. The signal might still be fine, but if the broker is messing with execution on their end, you won’t see it in the data. The numbers just stop working and you don’t know why.
I still have the suspension email. From my side, the EA was just taking small mean-reversion trades following its rules. From the broker’s side, apparently that was enough to get flagged.

Does the Strategy Still Work?
Probably yes. The market behavior — thin liquidity overnight, price overshoots and snaps back — hasn’t really changed. The approach still makes sense. The Python rebuild reproduced the pattern on recent data without much trouble.
But the broker problem is still the same. Running this on a B-book retail broker and expecting it to keep working long-term is not realistic. Once the results are too consistent, they will degrade your execution or just flag the account. The strategy part is not hard. The hard part is finding a broker that won’t mess with you.
If I were to take this further, the next step would be to pull M1 data for the full pair basket and run the rebuilt rules across all of them with shared risk control. That’s the version closest to what I actually traded live. For now, I just wanted to document what I had, and that’s done.