
I built this project to test a practical investing idea: instead of buying small-cap stocks every month no matter what, can I use simple market rules to decide when small caps are worth holding?
Small-cap stocks can do well, but they can also stay weak for a long time. I wanted to build a system that still invests monthly, but avoids blindly adding money during weak small-cap periods.
Why I Compared Against IWM
I used IWM as the main comparison because it tracks the Russell 2000 small-cap index. IWM is basically the simple version: invest monthly into small caps and hold. So the question wasn’t “can this beat every index?” — it was simpler: can this improve a small-cap DCA approach compared with just buying IWM every month?
System Design
The system has five parts. It loads stock data, builds signals, decides the market state, selects stocks, and then simulates monthly investing with trading costs.
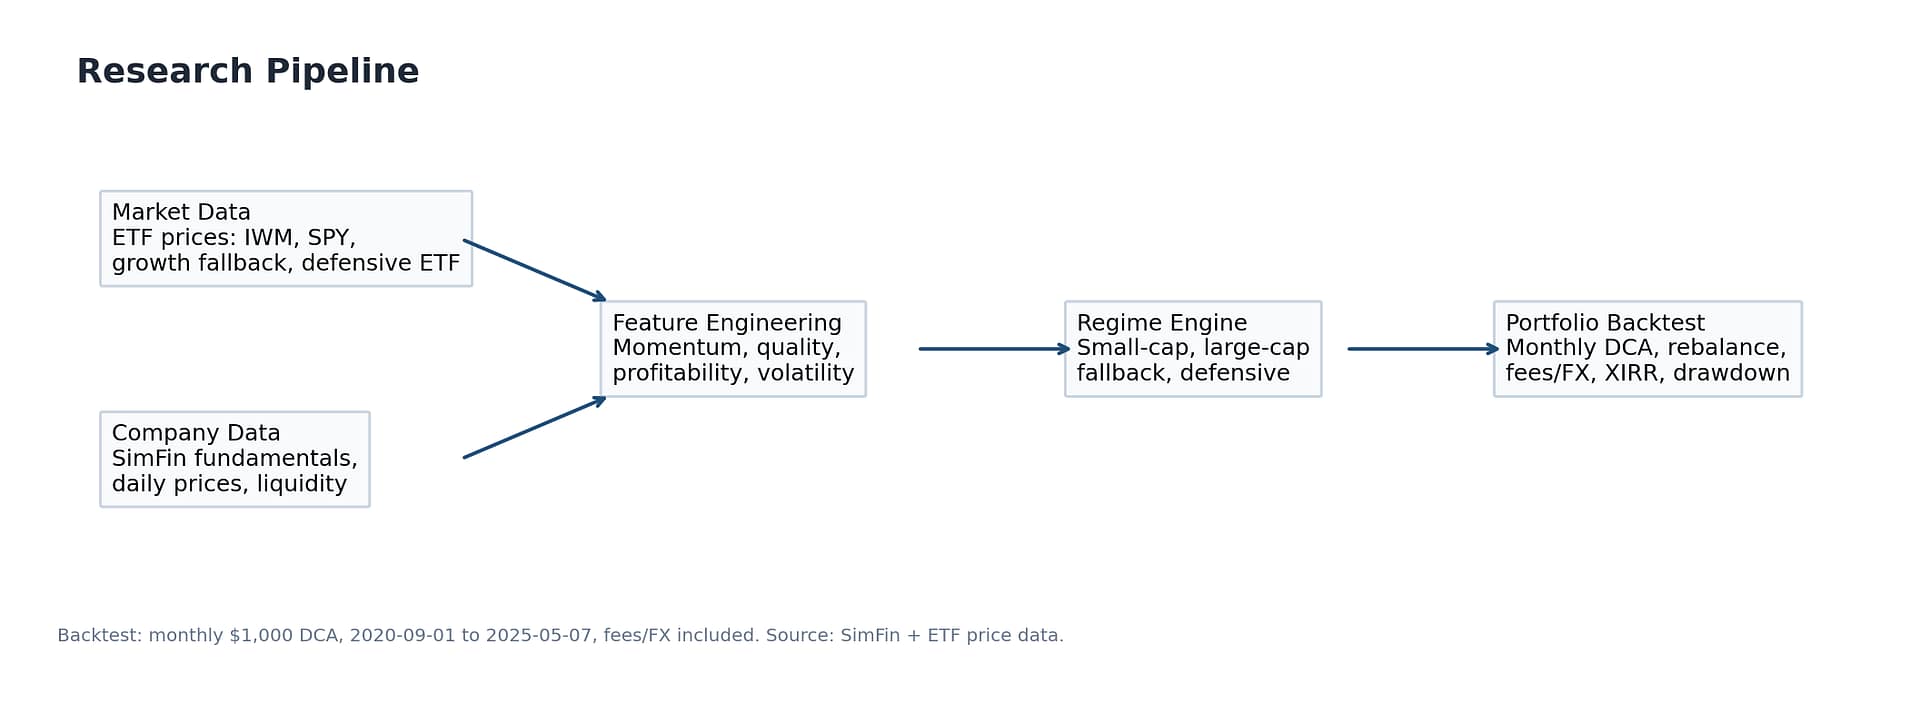
| Part | What it does |
|---|---|
| Data loading | Loads company fundamentals, stock prices, and ETF prices. |
| Signal building | Calculates profitability, momentum, liquidity, volatility, and balance-sheet signals. |
| Market state check | Decides whether to hold small caps, use a fallback ETF, or stay defensive. |
| Stock selection | Ranks small/mid-cap stocks and picks the strongest candidates. |
| Backtest | Simulates monthly investing, rebalancing, fees, returns, and drawdowns. |
How the Market Rules Work
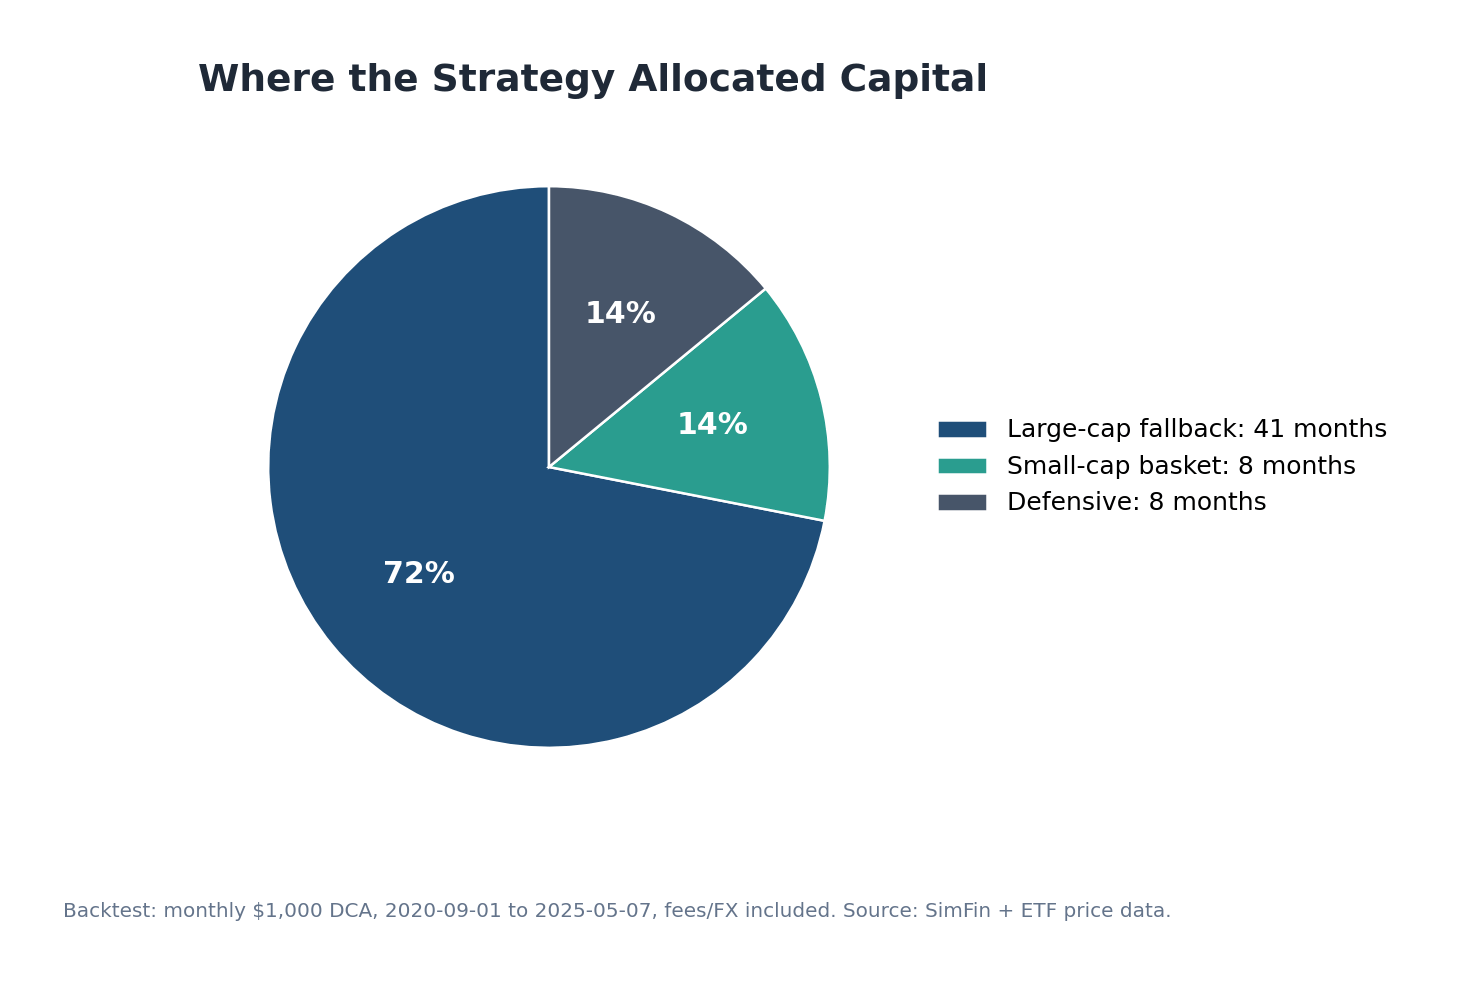
Each month, the model checks two things: are small caps doing well, and is the overall market still healthy? Based on that, it chooses one of three actions:
- Small-cap basket (8 months, ~14% of the time): When small caps look strong, the strategy buys a basket of 30 selected small/mid-cap stocks.
- Large-cap fallback (41 months, ~72% of the time): When the market is still okay but small caps don’t look attractive, the strategy uses a broader growth ETF instead.
- Defensive (8 months, ~14% of the time): When the market looks weak, the strategy moves to short-term Treasury bills to reduce losses.
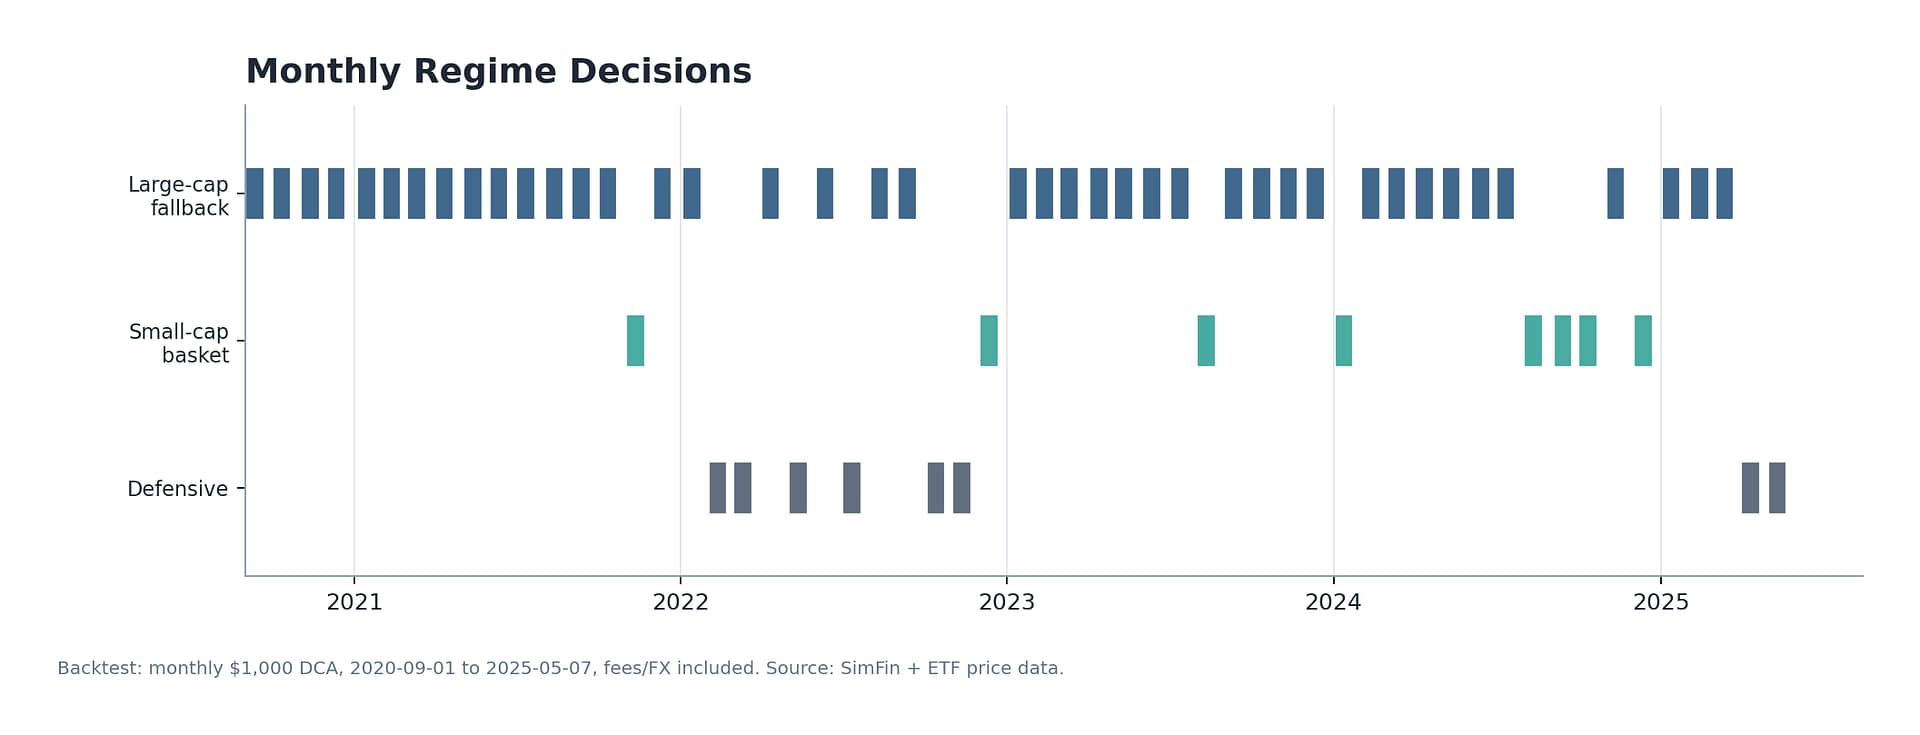
The timeline shows when the model changed position. It moved defensive during weaker market periods, especially around parts of the 2022 selloff and early 2025 volatility. It only bought the small-cap basket during a few stronger windows.
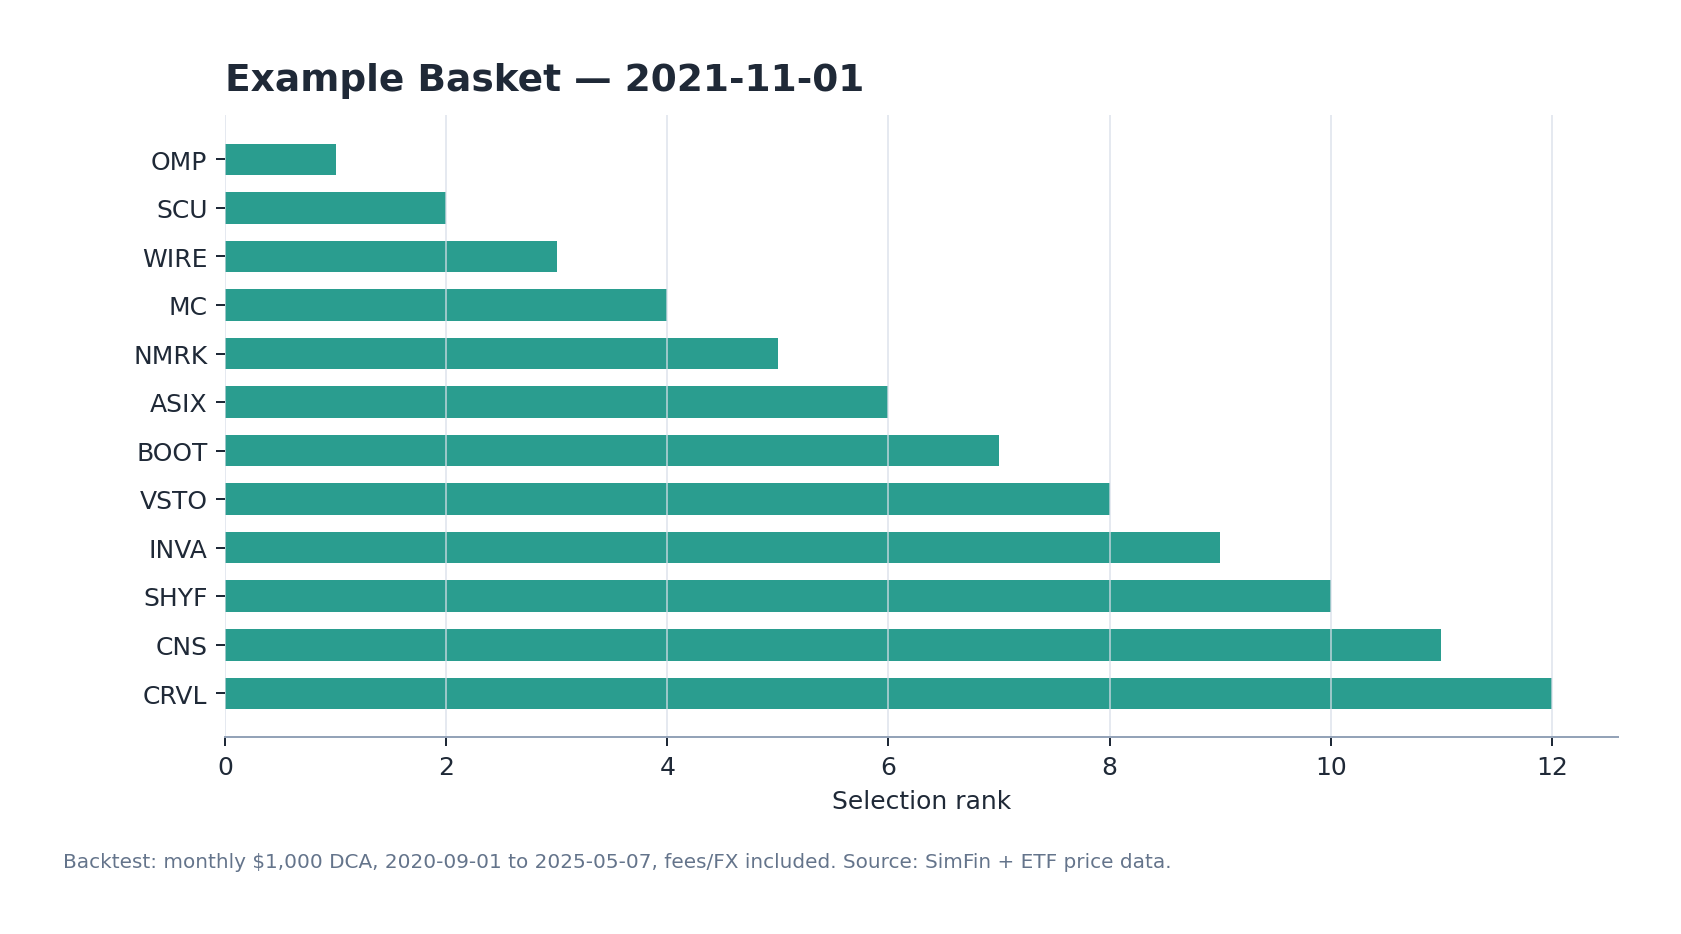
Stock Selection
When the model chooses small caps, it doesn’t buy the whole Russell 2000. It screens companies first and picks 30 stocks, trying to avoid weaker ones with poor earnings, weak balance sheets, or low trading volume.
| Filter | Examples | Why it matters |
|---|---|---|
| Profitability | ROA, ROE, net margin, positive net income | Prefer companies that are actually making money. |
| Momentum | 6-month and 12-month price strength | Prefer stocks already moving in the right direction. |
| Balance sheet | Equity-to-assets, positive equity | Avoid companies with weak financial structure. |
| Trading quality | Minimum price, market cap, dollar volume | Avoid penny stocks and stocks that are hard to trade. |
| Risk | 63-day volatility filter | Avoid stocks with extreme price swings. |
The selected basket can look very different from the index. For example, in November 2021, the model picked names like WIRE, MC, and VSTO, which came from more traditional business areas instead of only high-growth tech names.
Backtest Setup
I tried to keep the test realistic. The backtest runs from September 2020 to May 2025, which includes both strong and weak market periods. I also included trading fees and FX costs instead of assuming free trading.
| Period | 2020-09-01 to 2025-05-07 |
| Monthly contribution | $1,000 |
| Main comparison | IWM DCA (monthly $1,000 into IWM) |
| Trading fee | $1 per trade |
| FX cost | 0.2% |
| Rebalancing | Monthly |
| Metrics | Final value, return, max drawdown, trades, fees |
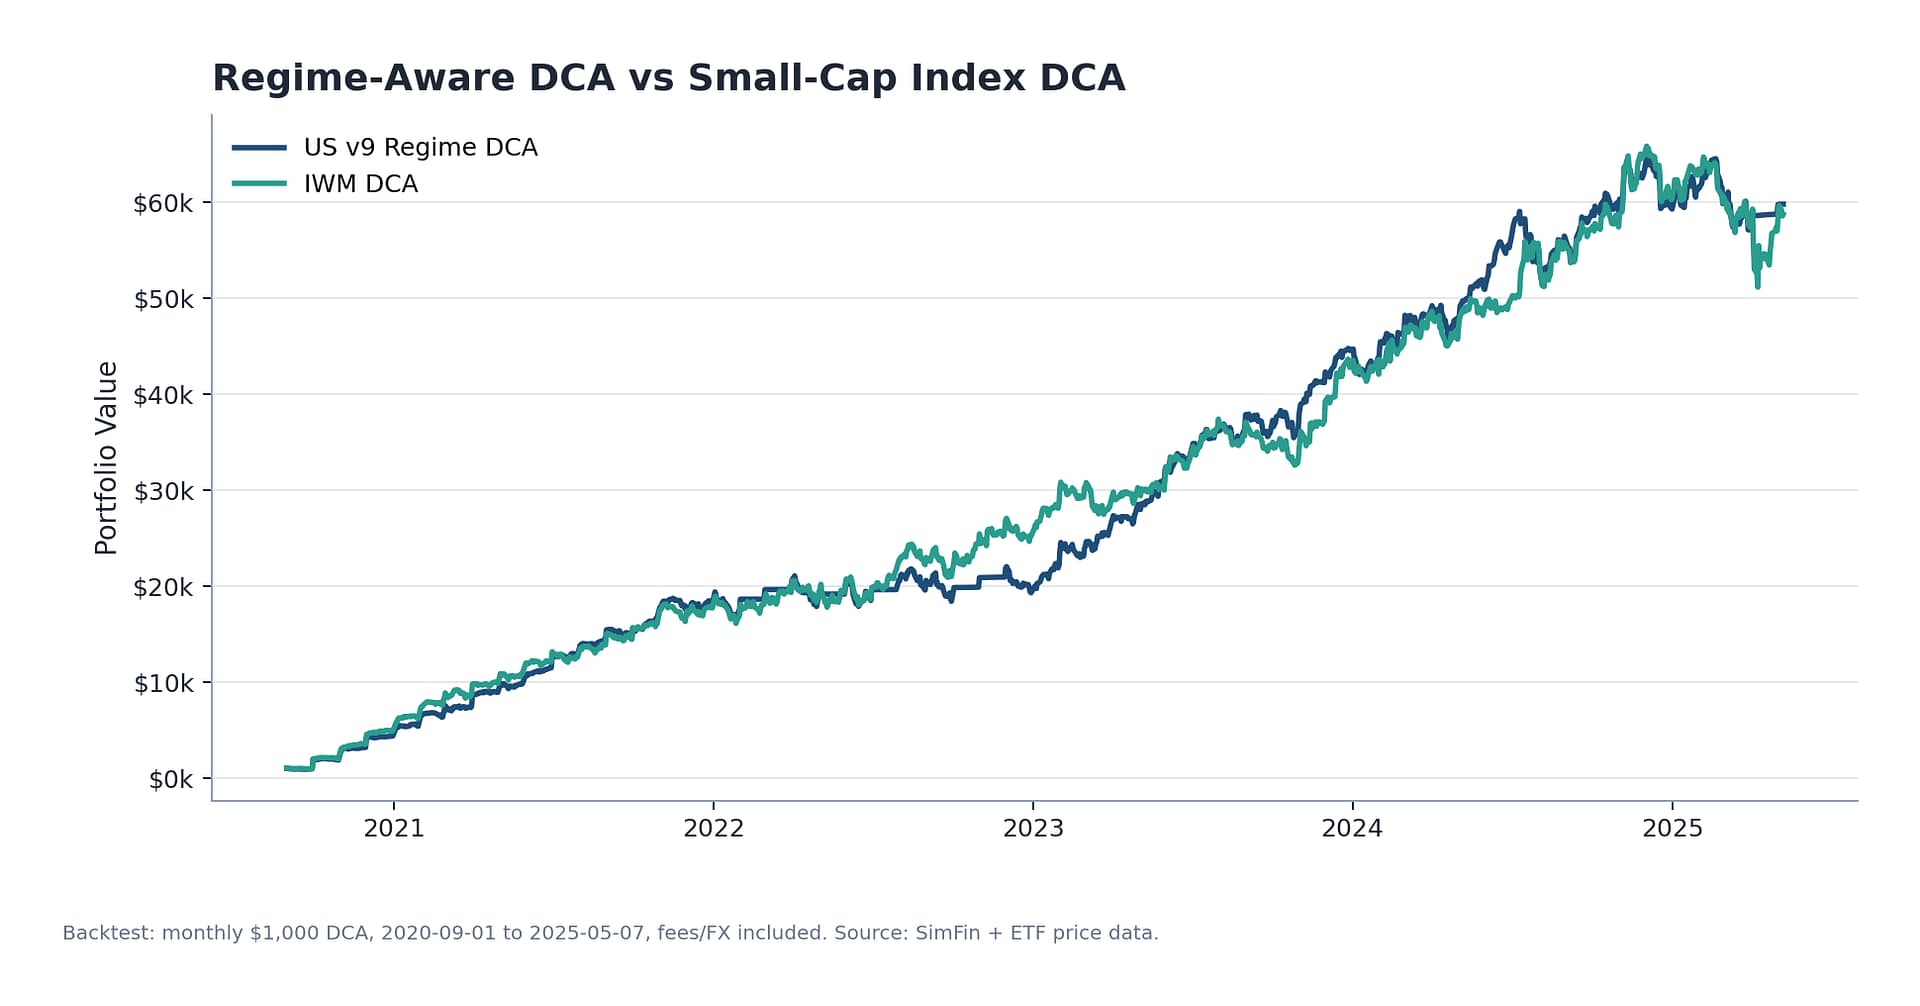
Results
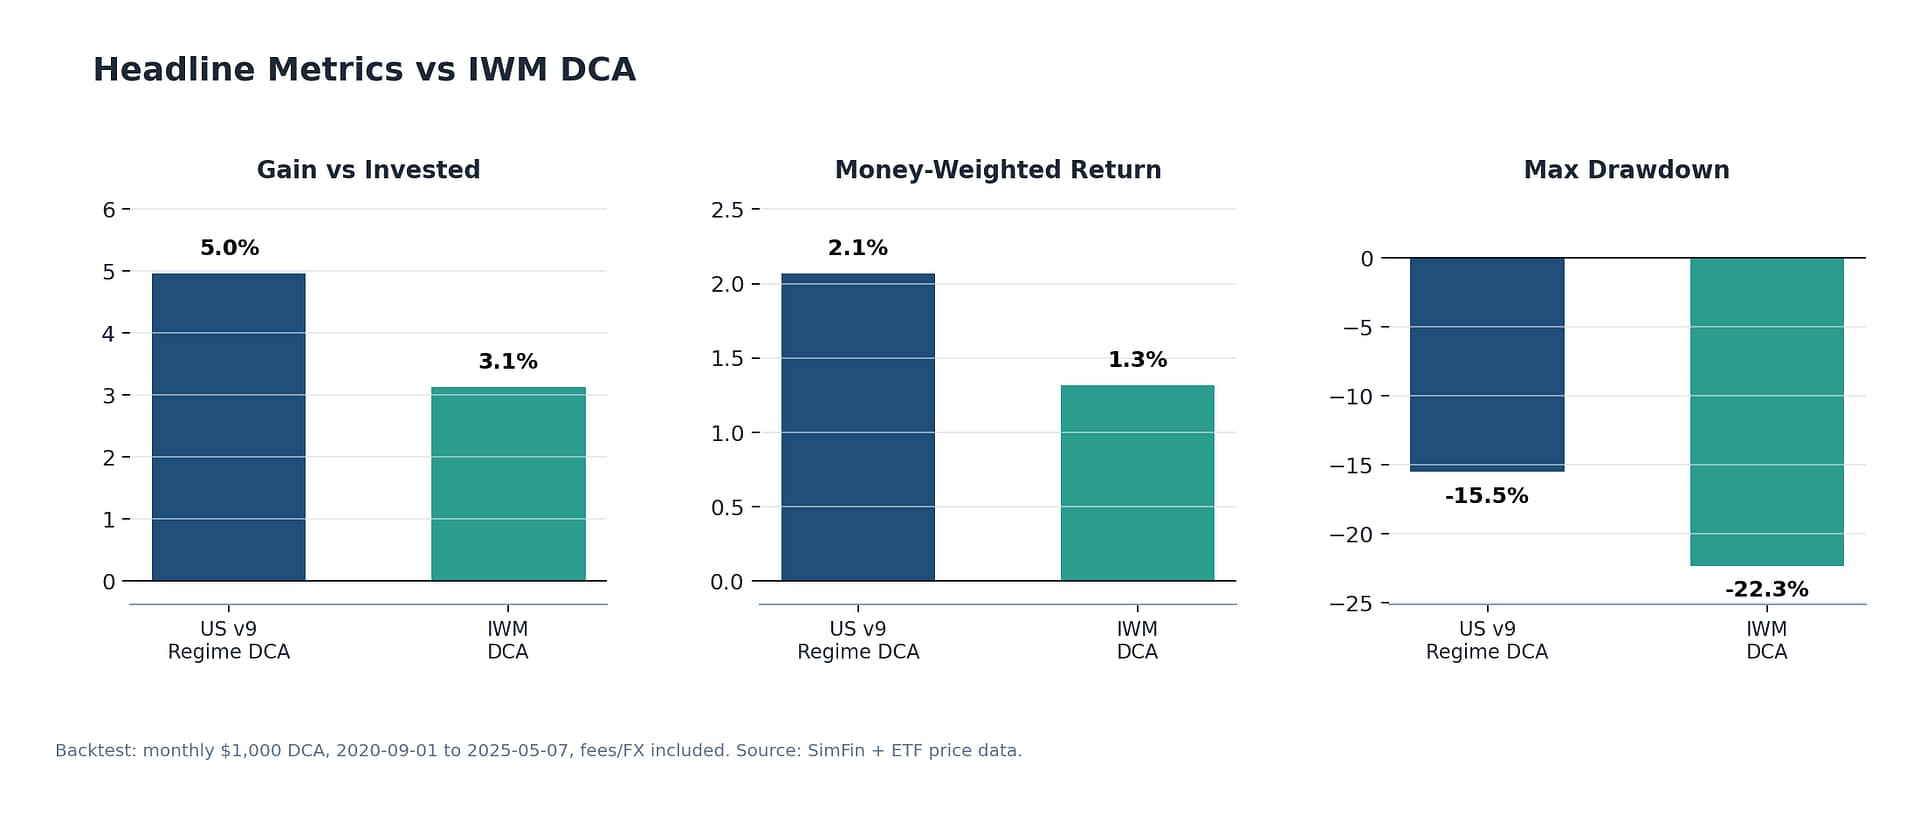
The chart below shows the main result. The two strategies were close for a long time. The difference became clearer in weaker periods, when the model moved away from small caps and avoided part of the drawdown.
| Strategy | Final Value | Gain vs Invested | Annualized DCA Return | Max Drawdown | Trades | Total Fees |
|---|---|---|---|---|---|---|
| US v9 Regime DCA | $59,829 | 4.96% | 2.07% | -15.52% | 289 | $881 |
| IWM DCA | $58,787 | 3.13% | 1.32% | -22.33% | 57 | $171 |
In simple terms:
- Final value: The strategy ended with about $1,042 more than IWM DCA after investing around $57,000.
- Return: The annualized DCA return was 2.07%, compared with 1.32% for IWM DCA.
- Max drawdown: The worst drop was -15.5%, compared with -22.3% for IWM. This is the main benefit — reducing drawdown by 6.8 percentage points.
- Cost: The strategy traded more often, so it paid more fees. This is the main tradeoff.
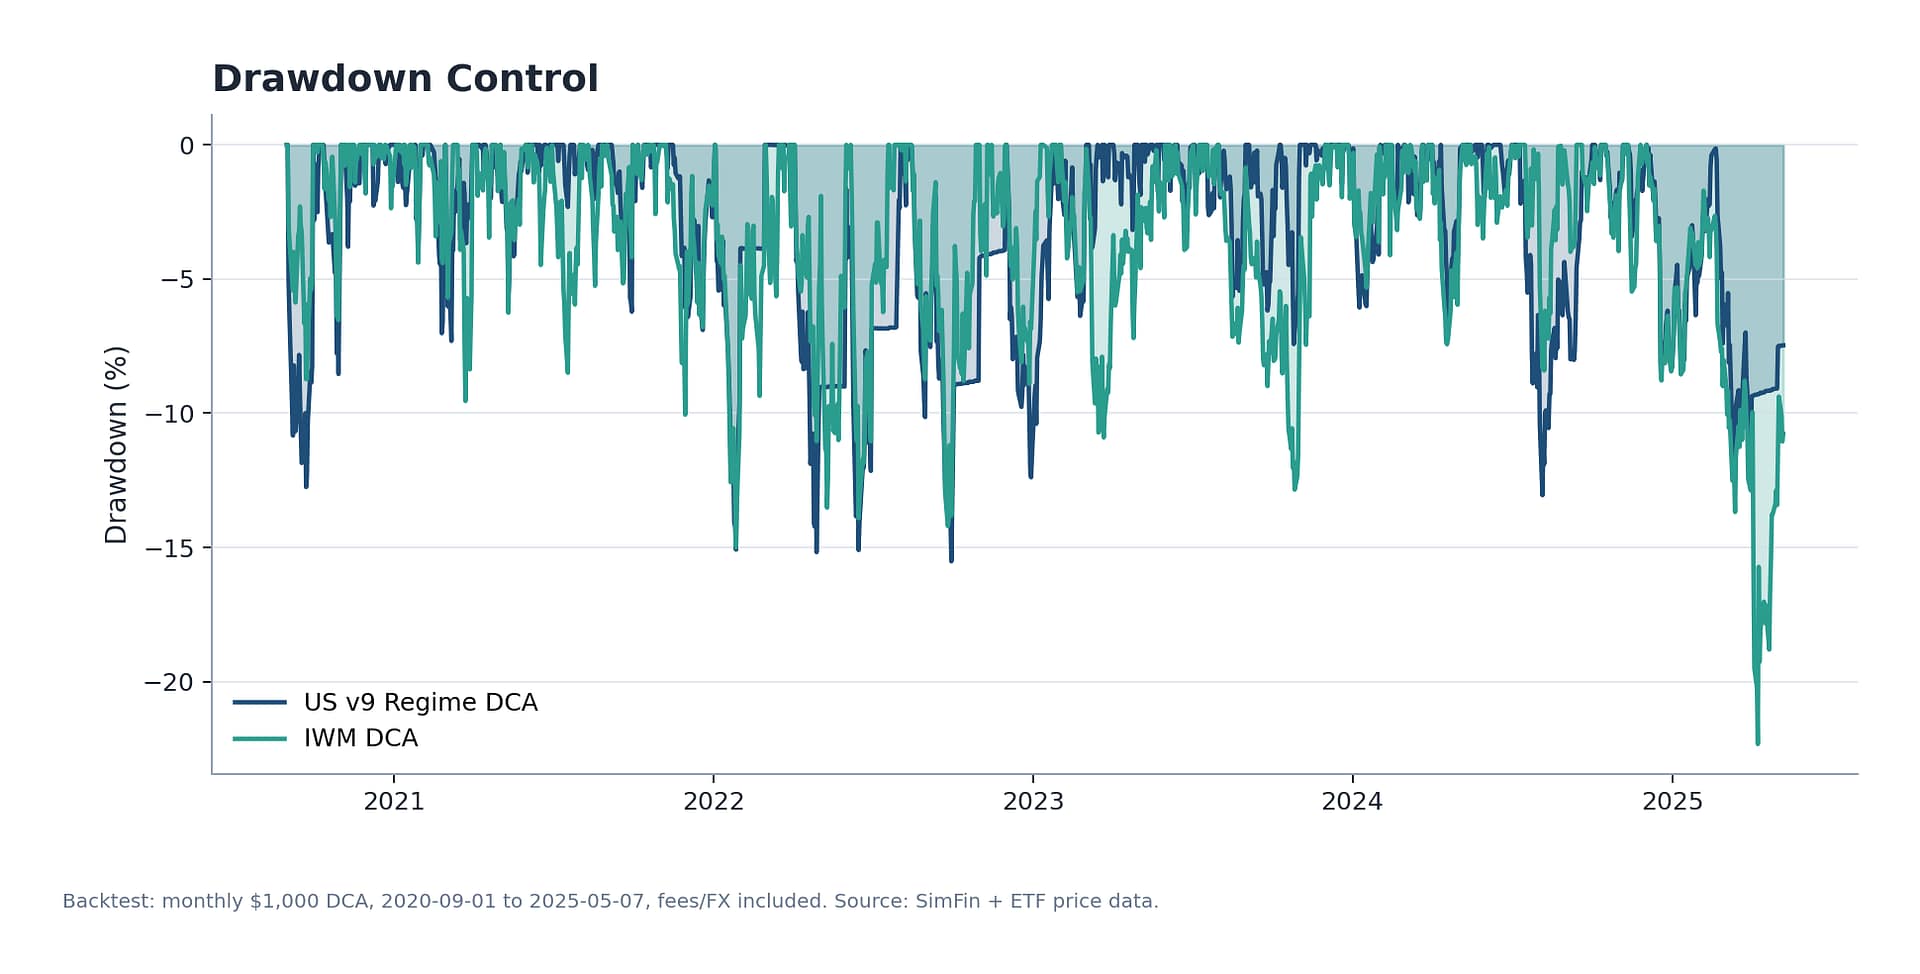
When the Outperformance Happened
The strategy didn’t beat IWM every month. Most of the advantage came during weaker market periods, when the model avoided part of the loss. The chart below shows the dollar gap over time.

The strategy sometimes fell behind during strong markets, then caught up when the market got weaker. It wasn’t designed to catch every rally, it was designed to reduce losses during bad periods. So this kind of pattern is expected.
The Cost of Being Active
The main downside is trading cost. The strategy made 289 trades, compared with 57 for IWM DCA. It paid $881 in fees, while IWM DCA paid $171.
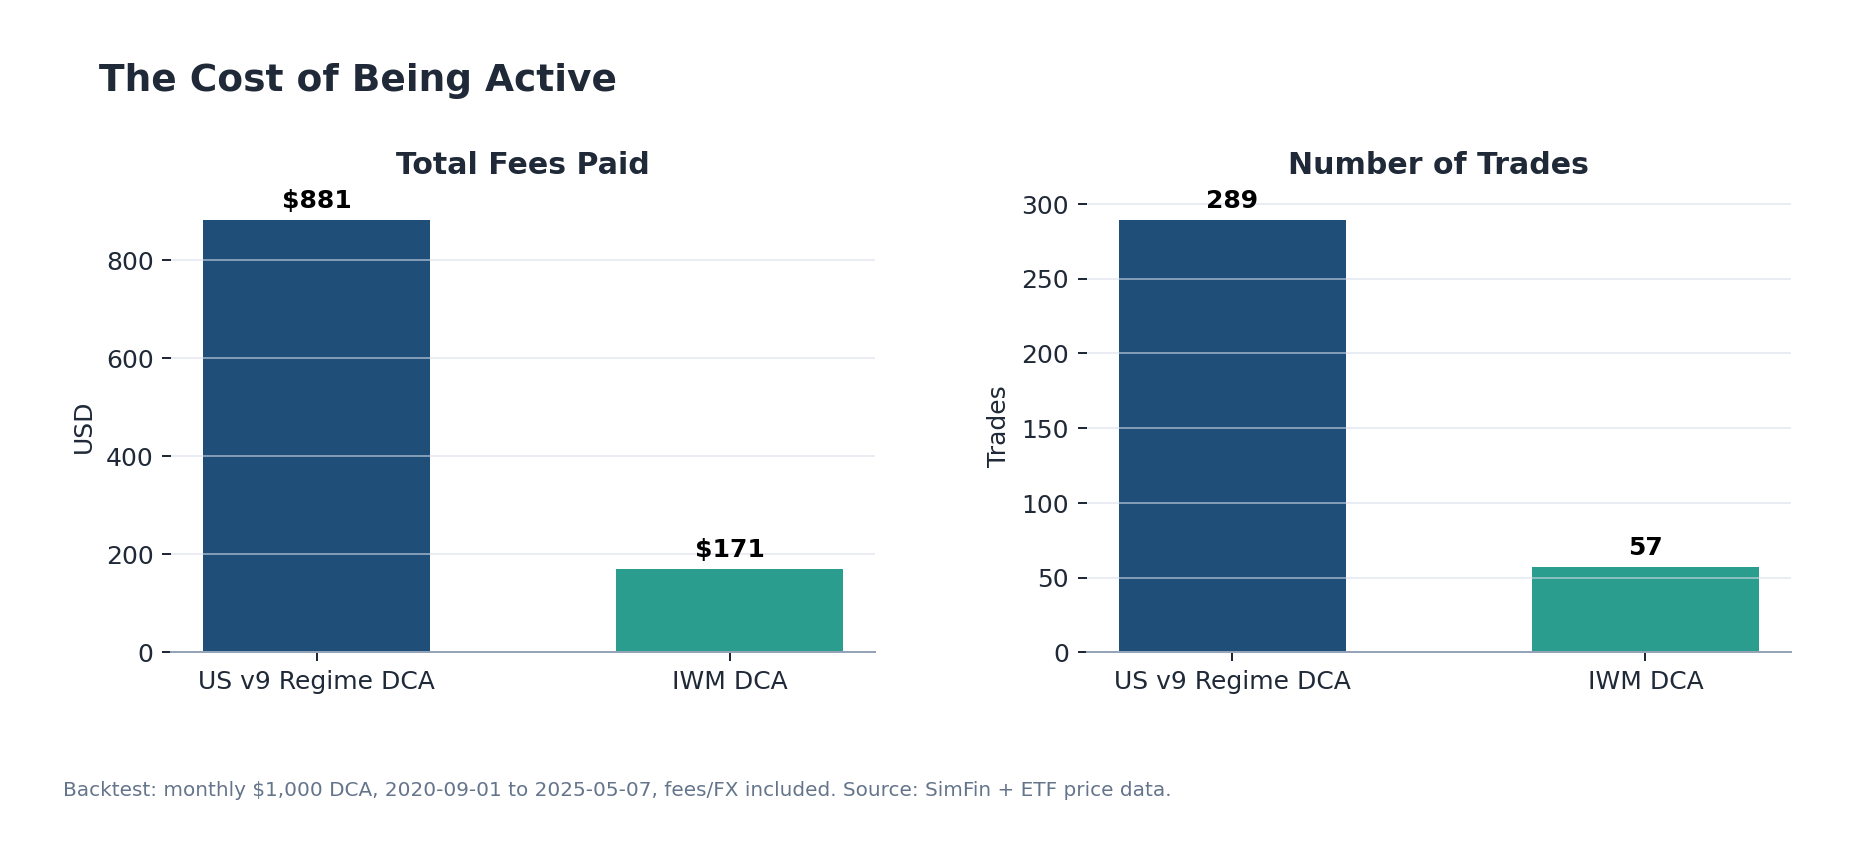
The extra trading still helped overall, but the margin wasn’t huge. The strategy ended about $1,042 ahead, while paying $710 more in fees. So this works better if trading costs are low.
The DCA Mechanics
For DCA backtests, I also like to compare portfolio value with total money invested. The shaded area below shows total contributions. The lines show how much those contributions became over time.

What Worked and What Didn’t
The result is not perfect. Moving defensive helped reduce losses during weak periods, and some of the small-cap stock picks helped the strategy recover later. But the strategy was sometimes too conservative — it spent most months in the fallback ETF, so it missed some small-cap rallies. The signal also reacts with a delay, so it can switch after a move has already started.
Overall the strategy reduced drawdown by 6.8 percentage points, but the return improvement was small. It works better as a risk-control idea than as a way to get high returns. And the comparison matters — I compared against IWM because this project is about improving small-cap DCA, not about beating every possible index.
What I’d Do Next
If I continue this, the priority would be:
- Test on more periods: Run the strategy on more historical data to see if the rules still hold.
- Check rule sensitivity: Change the rule thresholds and see if the result is still similar.
- Reduce trading: Add rules that avoid switching too often, like waiting for two months of confirmation before changing position.
- Control sector exposure: Avoid letting the stock basket become too concentrated in one industry.
- Check survivorship bias: Make sure the test includes companies that disappeared or were delisted, not only the ones that survived.
This is still a research prototype. The test period is short and the rules need more validation before this could be used as a real investment system. But as a way to think about when to hold small caps and when to step back, I think it’s a decent starting point.