This is an individual project of SDSC3014 – Introduction to Sharing Economy. I did the project in my year 2 2021/22 Semester B.
Presentation Slides:
Course Instructor: Prof. KE Qing
1. Introduction
Although I have finished studying the entire course of SDSC3014, I as a student of data science should keep improving ourselves by reviewing what I have learnt. So taken the chance of this project, I decided to combine all the things from the tutorial to finish a data exploration on Airbnb Hong Kong. So that I can grab this chance to play with different useful libraries and familiar with them.
Airbnb is one of the giants of the sharing accommodation platform. It arises gives a big revolution on the traditional property management industry and it is always one of the best examples of business models on sharing economy.
This report proposes to analyze the Airbnb Hong Kong, I will analyze the listings data provided from Inside Airbnb, I will do some pre-processing first then extract some different insights from it. Apart from that, I will scrap the tweets from Twitter that tagged #Airbnb and try to conduct a sentiment analysis on the dataset I got.
2. Method
2.1 Data Scraping

As I have mentioned from the introduction, I have scraped 5000+ data from Twitter by using Facepager 4.4. It is the dataset that I will use to do the text analysis.
2.2 Data Import


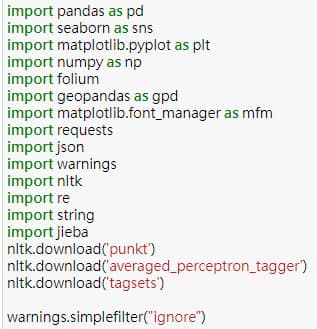
First, I have to import all the library I needed to use later. I will use Pandas, Geopandas, Numpy to do the Data manipulation. Folium, Seaborn, Matplotlib, LinearColormap, WordCloud will be used to do the Data Visualization. And NLTK, TextBlob to do the Natural Language Processing. There will be mainly four datasets in total. One is from the tweets.

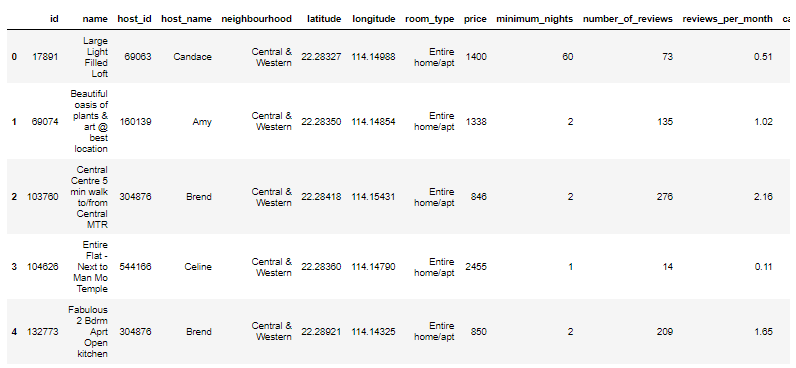
And these are the other three dataset, they are all come from Insideairbnb.com. I will use them to do the Data Visualization part and Text Analytics as well. The first 2 datasets are used for finding insight from the dataset by plotting different graph and conduct Text Analytics on the Airbnb listing name and description. The Geojson data file is used for plotting folium map.

In more detail, dataset 1 is the summary information and metrics for listings of Airbnb in Hong Kong (Used for visualizations).

And another dataset 2, I will only focus on this two columns, name and description, which will be used to generate word cloud and apply text analytics on them.
2.3 Data Cleaning


The dataset for visualization, I have removed some of the column that full of Null value and dropped some columns as well as I am not going to use most of them.

I also built a new dataframe that only contain neighborhood info so that it is easier to find out which neighborhood have the higher Airbnb average listing price in Hong Kong later. And I sorted it for later plotting use as well.


And the last dataset, the twitter one, I dropped the first row of it and rows that contain Null value. I only extract the text column out which are the tweets content. I cleaned the whole text by removing RT, Punctuation etc. by using lambda function. RT is the retweet sign generated by Twitter.
3. Result
3.1 Data Visualization

In this part, I will share some cool facts I found out from the dataset by using Seaborn. First, I tried to plot the Airbnb Price Count but it doesn’t look well. Obviously, there are some outliers with very high price, so we better take the logarithm of prices to avoid plotting this kind of skewed graph.

Now, it should look way more towards the normal distribution.

I also think of the second method to deal with this kind of problem. We can simply remove the outliers by using the standard deviation value, which is 2189 here. After removing the outliers, we can conclude that the range of Airbnb price in Hong Kong should be around 200HKD-800HKD.

I have also tried to find out whether any relationship between number of bed and price, but it seems that the sample size of larger number of beds (10-16) are clearly not enough, so we can’t really make a conclusion from this graph.

From this graph, we can see that in Hong Kong Airbnb listings, most of them are renting either entire apartment or private rooms, only few are renting shared room and hotel room.

From this catplot, it shows us that the shared room is relatively cheaper in price and entire apartments are the most expensive type of listing which is totally reasonable in Hong Kong.

This countplot shows us that most of the Airbnb listings are came from Yau Tsim Mong and Wan Chai. We can see that Yau Tsim Mong district has over 2000 available listings in Airbnb.

Now, I want to apply some skills from the tutorial lessons by using Folium and Geopandas library. In practice, I would generate a map by using the dataframe we just prepared before in order to display the mean price of listing from different neighborhood areas. This one is the original Folium map captured from tutorial 2 Jupyter Notebook directly. Nothing was edited yet.

Now, I have changed the original code by Professor Qing in order to fulfill my current needs. You can see that I have used linear colormap library here so that when the mean price is higher in a neighborhood area, the color will be deeper too.

This is the result. We can clearly see that Tuen Mun and Tsuen Wan are the two highest average listing price districts in Hong Kong.

Now, I want to find out how many listings per each neighborhood area and plot them directly in the Folium map. I have used a plugin called FastMarkerCluster to fulfill my needs. FMC allows us to plot the number of listings interactively on the map.
This is the result; you can see that those Airbnb listings are plotted into dynamic bubbles. Clearly, Kowloon Yau Tsim Mong won this competition as this area got the highest number of bubbles among Hong Kong.
3.2 Text Sentiment Analysis

![NLP][Python] 英文自然語言處理的經典工具NLTK - Clay-Technology World](https://mlcznkdztmb6.i.optimole.com/w:auto/h:auto/q:mauto/ig:avif/f:best/https://philip.twinight.co/portfolio/wp-content/uploads/2024/03/nlppython-nltk-clay-technology-w.png)
You may have heard of TextBlob before, it is very famous in NLP analysis as NLTK too. And it is built on top of NLTK too, we can use and process the text in a few lines of code by using TextBlob. Both of them can help us easier to generate simple sentiment result without training any model.

It helps me to generate the sentiment result by using its polarity score of TextBlob. Polarity score only lies between -1 to 1, -1 defines a negative sentiment and 1 defines a positive sentiment.

So, from this graph, we can see that most of the tweets are in neutral or positive sentiment.

I also used the code from tutorial 10 to extract the positive and negative adjective words from the tweets I scraped.

This is the result of the wordcloud generated from the tweets dataset, I will explain it more in the limitation part.

I also plotted a bar chart to show which word appeared the most in the name of Airbnb listings. And they are room, studio, mtr etc.

So, in order to build a more successful and beautiful wordcloud, I used the description of Airbnb listing as the input data. We can clearly see that space, apartment, walk or Hong Kong are some of the most used words. That’s the word cloud wallpaper of Airbnb in Hong Kong version I built.
4. Limitation
Through the example of failed wordcloud from the scraped tweets given in Part 3.2, I can conclude that the experiment was failed mainly due to the low quality of the input. It can be simply described as a term called Garbage in, Garbage out. The reason behind that is most of the tweets I scraped from Twitter that tagged #Airbnb are spamming or in a different language so NLTK can’t recognize them properly. I have tried that with different translator library of Python. But all failed in the end due to large amount of data that have to be translated. Their server simply disconnected while I was trying to do that.
The second limitation of why I have to use the Twitter platform instead of Facebook, it is because Airbnb Hong Kong not really active in Facebook and all of them are interacted in Cantonese which should be even more hard to translate. Apart form that, Facebook graph API got bunch of restrictions and I failed to get the data I want from them. So, I have to use the third-party tool called Facepager to do web crawling on Twitter instead of Facebook as Twitter’s API is more open compared to Facebook one due to more privacy content in Facebook.
5. Future research and Conclusion
In future study, I may consider learn and build more experience on web crawling as it is still a brand-new topic for me. Also, I have thought of another solution to solve the problem of translation. I think I can try to translate it outside Python so that I do not have to rely on the translation server of those library/package that used for translation. Another solution is I can simply scrap more tweets from Twitter that contains the word ‘Airbnb’ instead of hashtag ‘#Airbnb’, then filter out only English content so that the dataset is more readable to NLTK/TextBlob.
Last but not least, the purpose and the learning objectives of this project is to let myself be more familiar with different useful libraries that we have learnt before and apply most of the skills from the tutorial of this course to finish the data exploratory task.
6. References
Tumer Kabadayi, E., Cavdar Aksoy, N., Yazici, N., & Kocak Alan, A. (2021). Airbnb as a sharing economy-enabled digital service platform: The power of motivational factors and the moderating role of experience. Tourism Economics.
https://doi.org/10.1177/13548166211044606
Shahul ES. (2021, December 3). Sentiment analysis in Python: TextBlob vs Vader sentiment vs flair vs building it from scratch. neptune.ai.
https://neptune.ai/blog/sentiment-analysis-python-textblob-vs-vader-vs-flair
Jayson DeLancey. (2020, May 29). NLTK and machine learning for sentiment analysis. CodeProject.
https://www.codeproject.com/Articles/5269448/NLTK-and-Machine-Learning-for-Sentiment-Analysis
Akash. (2021, October 9). Making natural language processing easy with TextBlob. Analytics Vidhya.
https://www.analyticsvidhya.com/blog/2021/10/making-natural-language-processing-easy-with-textblob/
SumedhKadam. (2021, July 5). Generating word cloud in Python. GeeksforGeeks. https://www.geeksforgeeks.org/generating-word-cloud-python/
Zaxliu. (2015, November 3). How to display Chinese in matplotlib plot. Stack Overflow. https://stackoverflow.com/questions/21307832/how-to-display-chinese-in-matplotlib-plot
